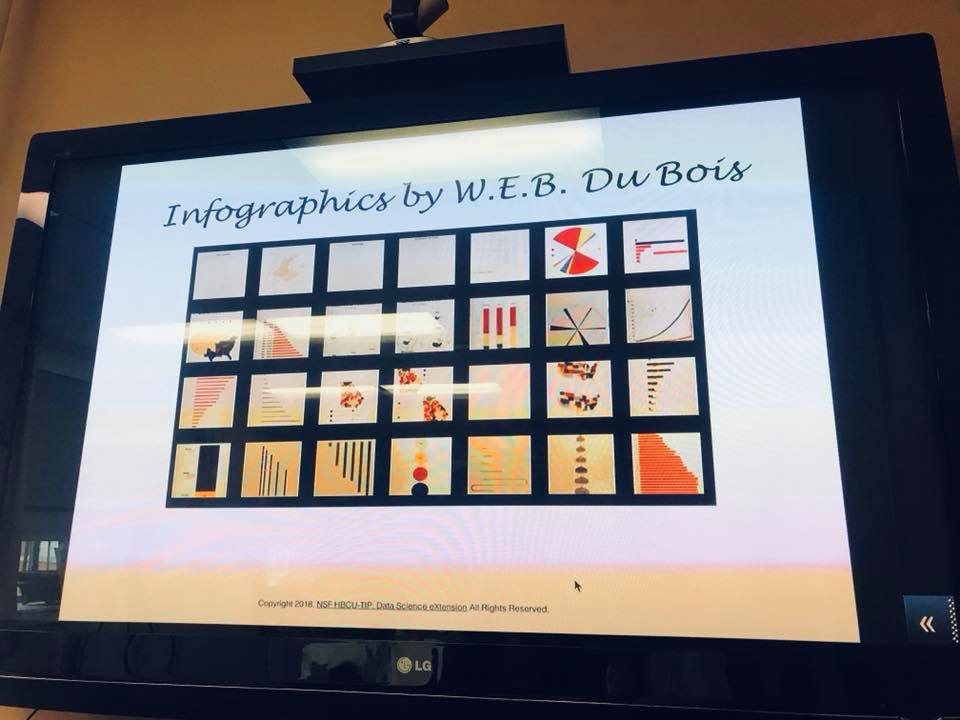
Data viz continues to be many people’s favorite part of the data industry. Colorful illustrations, easy eye candy for talks and presentations with data transformed into information. Creating these figures and charts takes certain skills. The problem we regularly see is that we wind up having more questions than answers when looking at these figures and charts. Whether you’re new to the data viz branch or leading a team, there are basics to make your figures and charts make sense AND stand out.
Dipping your toes in data visualization can help you hone in on what pieces of the figure or chart are most important and help clarify which questions to ask.
Tableau Short Tutorials
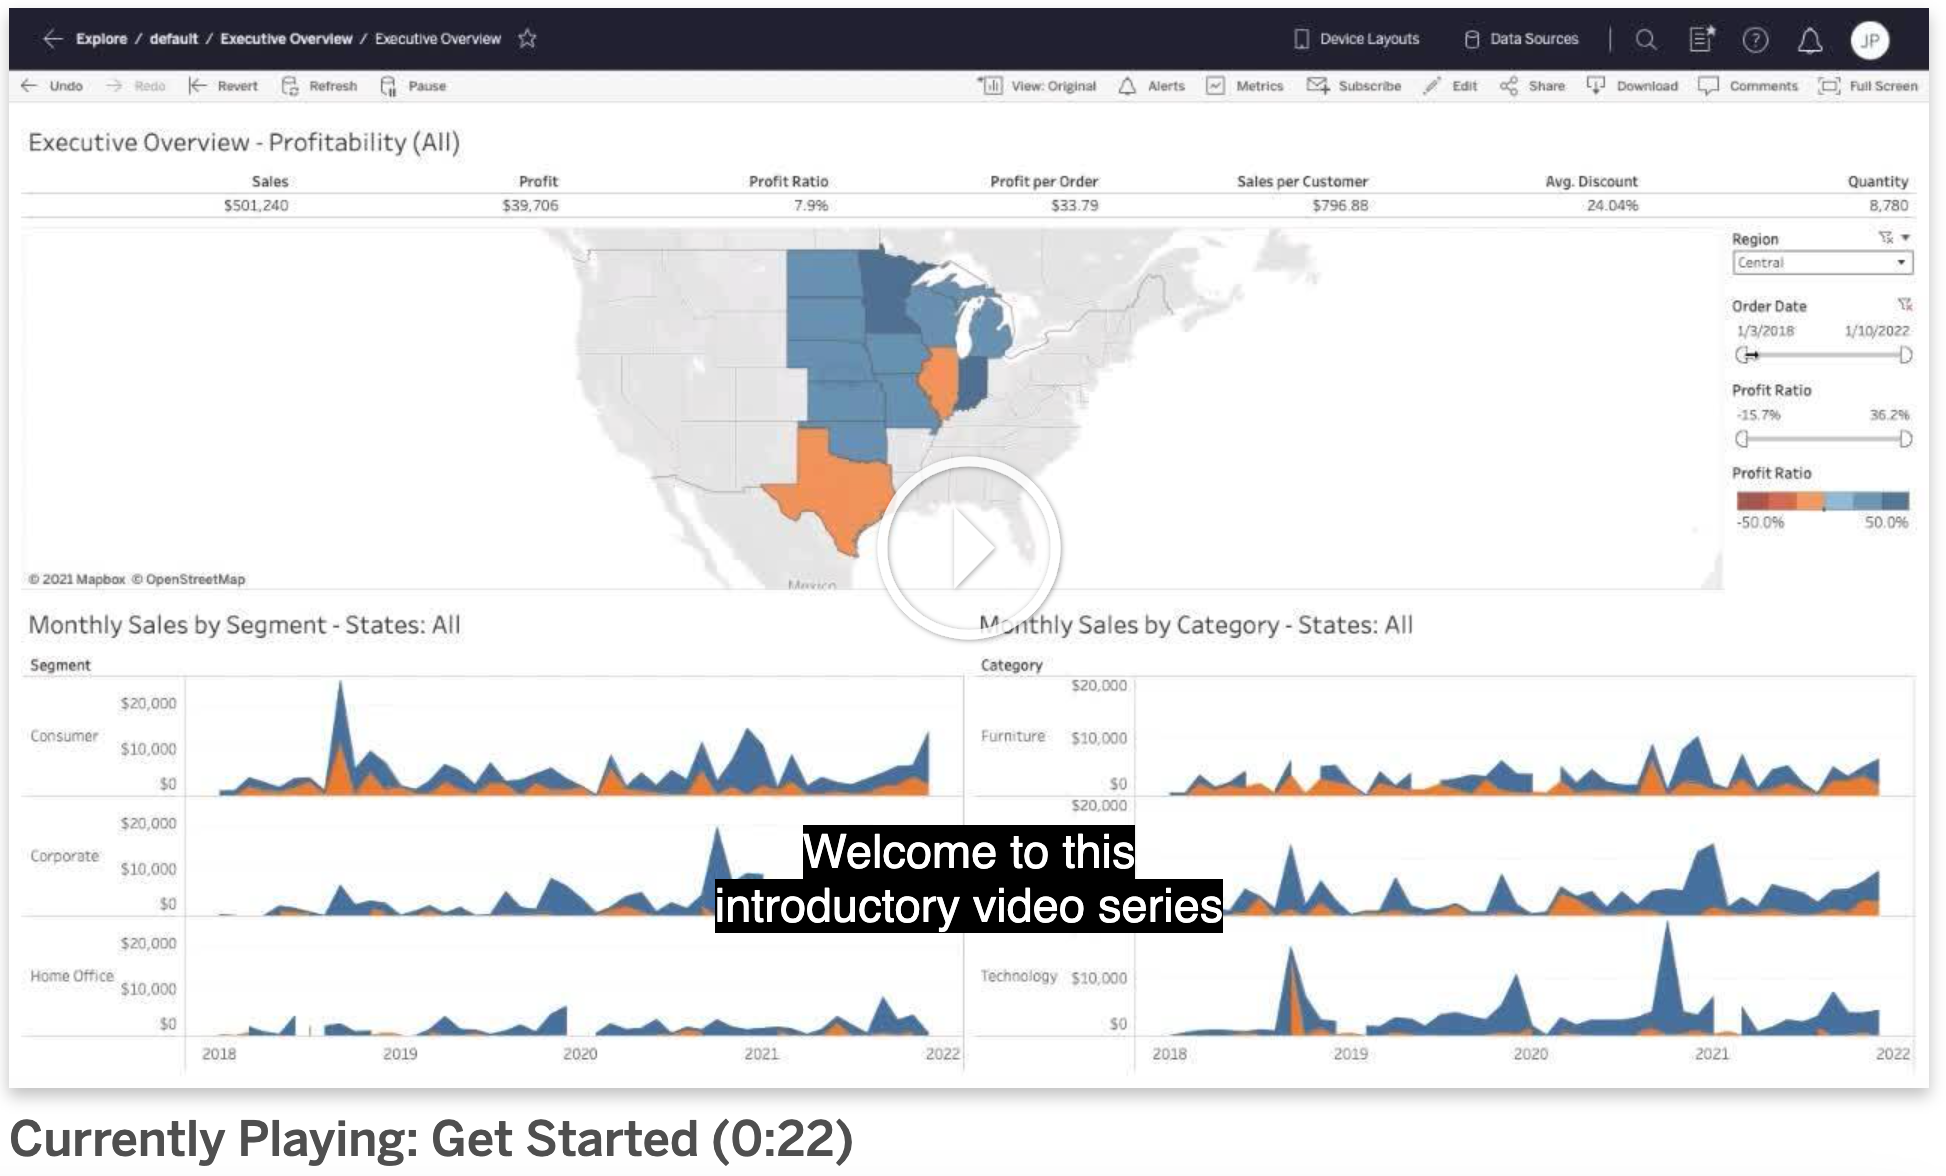
This Tableau resource from Guru99 describes the suite of Tableau software and shares a nice Excel vs. Tableau comparison table.
If you’re interested in a short Tableau demo, then go to Tableau Public Resource page and play the first tutorial: https://public.tableau.com/en-us/s/resources
Python Seaborn Tutorial by edureka!

Data visualization brings many of us joy to see the data come to life in visual form. We’re sharing an introductory 25-min Python seaborn tutorial. As a recap, Python seaborn provides a high-level interface for drawing attractive and informative statistical graphics, built on top of matplotlib. This tutorial uses Jupyter Notebooks to showcase several common methods in the seaborn module. You can follow along or elect to recreate the visualizations in your own Jupyter Notebook. If you’re looking for more formal tutorials, head over to the seaborn documentation page and click tutorials here: https://seaborn.pydata.org/tutorial.html.
Data Visualization Society
The Data Visualization Society was founded to serve as a professional home for those working across the discipline while leading others into this growing, dynamic field, and to increase the visibility and value of data visualization to the general public.
Our mission is to connect data visualizers across tech stacks, subject areas, and experience: we invite you to be part of our community.